How much do large companies spend developing new drugs? I started with this list on Wikipedia of the largest pharmaceutical companies, then went about gathering the SEC or other governmental filings made by these companies. I divided the amount spent on R&D by their total revenue, which has the nice effect of factoring out different currencies. Where possible, I'm using R&D and revenue numbers from just their pharmaceutical divisions, rather than the entire company. (I'm excluding consumer, generic drug manufacturing, medical instruments, and other lines of business so we can focus on new drug development.)
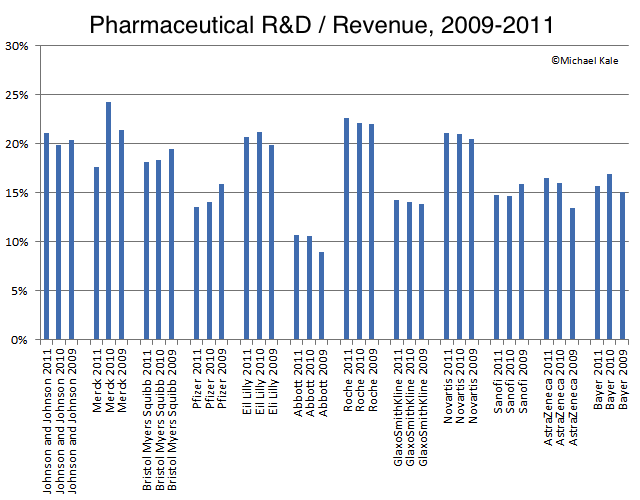
For the 12 largest pharmaceutical companies in the years 2009-2011, the following chart summarizes the results:
Taking the geometric mean of these data, we arrive at the average spending by each firm, as a percentage of revenue, for the years 2009-2011:
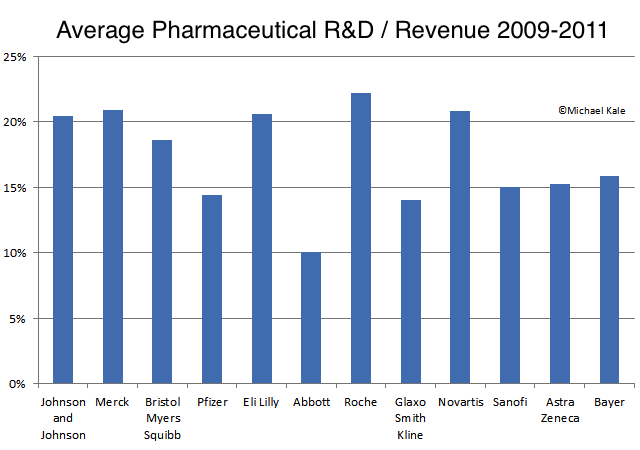
Some notes: For JNJ, Roche, GlaxoSmithKline, Novartis, Sanofi, and Bayer this is the pharmaceutical division only. For Bristol-Meyers Squibb, Eli Lilly, and AstraZeneca, these are numbers from the entire company, but near as I can tell it's almost entirely pharmaceutical. For Merck and Pfizer, these are numbers from the entire company, but near as I can tell it's 85%+ pharmaceutical, so the numbers are likely a little low but not too much. The only one where I wasn't able to find complete data (and it would make a difference in the rough charts above), is Abbott Laboratories. Roughly half of Abbott's revenue is "proprietary pharmaceuticals" (a.k.a. drugs developed by new research and still covered by patent). The other half is a variety of other things. But their SEC 10-K filing did not break out R&D spending by division. It did indicate that a majority of R&D is on proprietary pharmaceuticals, but without an exact number I had to use the total R&D spending / total company revenue. So the results above are lower than they would be if I was able to break it out, possibly considerably lower. (This probably explains why Abbott is such an outlier in the charts too.)
What can we learn from these data? Drug research is expensive! These numbers are higher than you typically see in large software and tech firms, where my background is. What are the different firms getting for their different levels of investment in R&D? Further analysis will dive a little deeper into these and other numbers to explore what we can about these firms.
Disclosure: my wife is employed by Johnson and Johnson, in a research capacity. All of my data comes from publicly available governmental filings and none of this is approved by her or her employer.